
COVID-19’s effect on energy and emissions – and implications for the future
By Marla Orenstein, Director, Natural Resources Centre and Patrick Smith, Policy Analyst
May 2020
Skip to PDF
How has the COVID-19 pandemic – and the associated restrictions on travel, commercial activity and personal mobility – affected global energy use and green house gas (GHG) emissions?
On April 30, the International Energy Agency (IEA) published an analysis showing that in the first quarter (Q1) of 2020, global energy use declined by just under 4%, and GHG emissions dropped by around 5%. For countries in full lockdown, energy use dropped by 25%, and for those in partial lockdown, by 18%.
These are historic decreases with an equally historic price tag.
But how do these energy use declines stack up to our climate commitments? What can we learn from this experience? And what does this mean as we move toward the energy systems of tomorrow?
How did energy use change?
The IEA estimated that as of April 28, roughly 4.2 billion people – representing 54% of the global population and roughly 60% of global GDP – were subject to either partial or complete lockdowns.¹ Countries in lockdown experienced an average 25% decline in energy demand (estimated over a weekly period) and countries in partial lockdown had an average 18% decline.
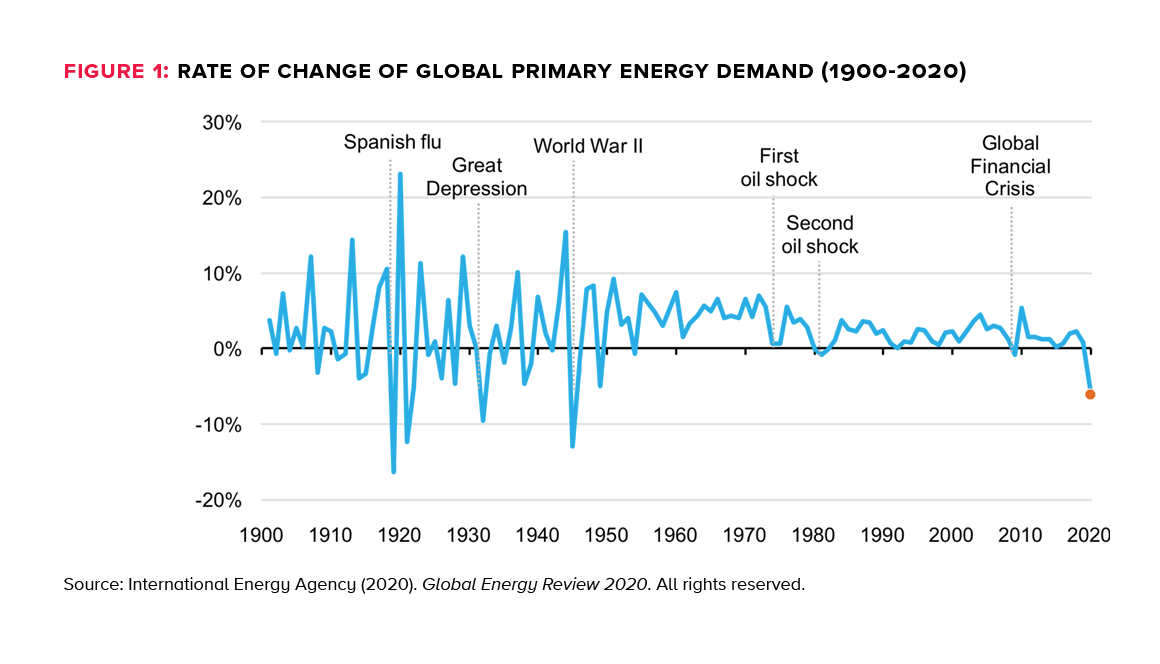
Overall across Q1 2020, global energy demand declined by nearly 4%. This may seem small in comparison (and the main reason is timing – Q1 ended on March 31, preceding the peak of the lockdowns), but this magnitude of decrease has not been seen since the Second World War (Figure 1).
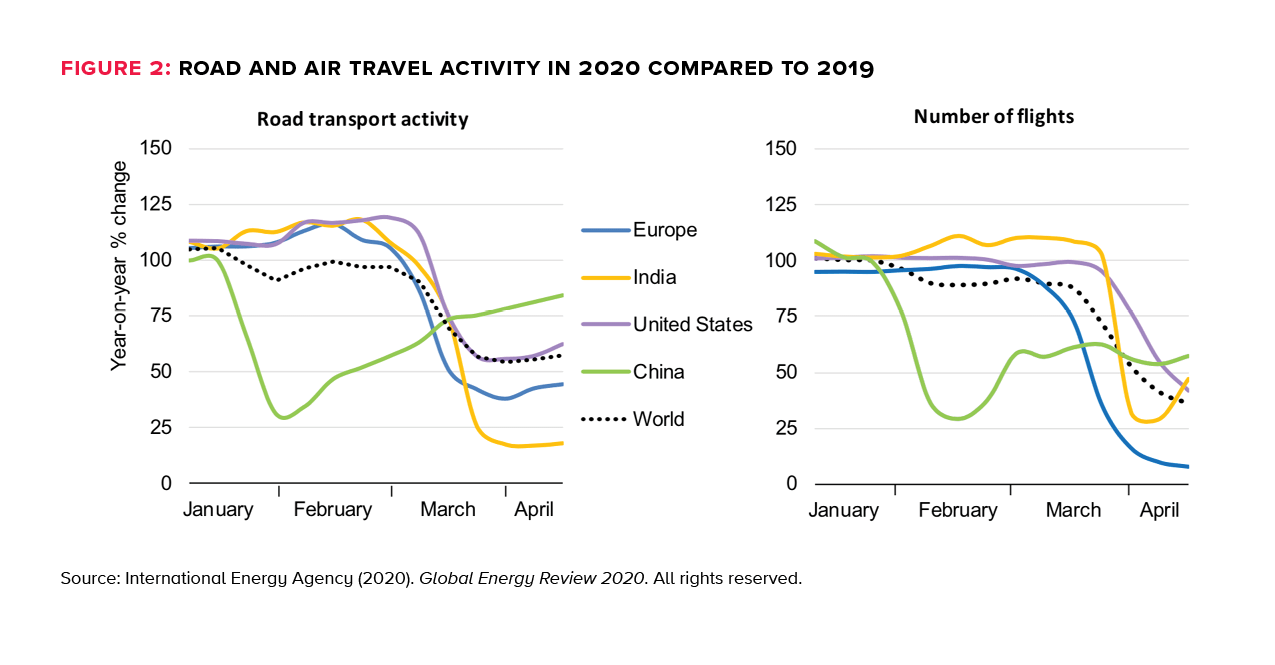
The most evident consequence of the lockdowns has been on transportation systems. According to the IEA, there was a 50-75% decrease in road transportation activity in regions with lockdowns, a figure commensurate with other estimates of a decrease in personal vehicle travel of around or over 50%.² Air travel was most profoundly affected; by the end of Q1 2020, global aviation activity decreased 60%, with some countries in Europe curbing air travel over 90% (Figure 2).
How did GHG emissions change?
As a result of these decreases in consumption, global GHG emissions also decreased.
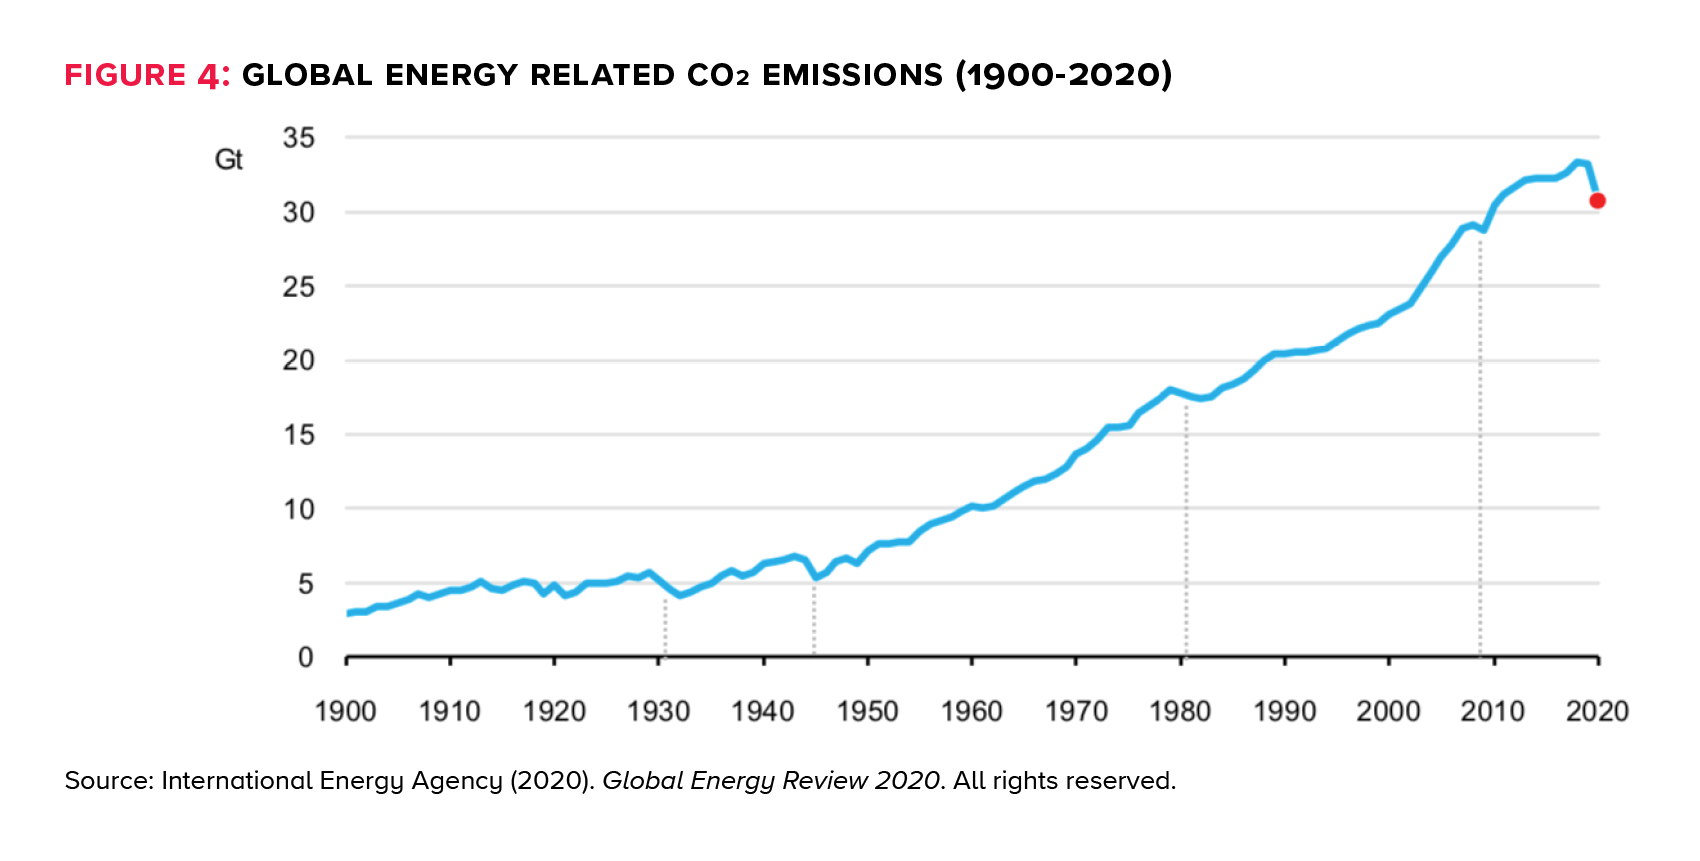
The IEA estimated that there was a 5% drop in global CO2 emissions in Q1 2020 compared to the same time in 2019 – fairly closely tied to the overall 4% decrease in global energy use over that same period Figure 4). Emission decreases were greatest in those regions that had the earliest and largest COVID-19 outbreaks and lockdown measures, including China (a decrease of 8%), the European Union (8%) and the U.S. (9%). The IEA stated that by the end of 2020, the total decrease in CO2 is expected to be around 8% globally for the year.³
The IEA did not provide estimates for decreases in CO2 emissions for lockdown periods specifically, but by extrapolating the data, we can assume that emission decreases were close to 25% and 18% for total lockdown and partial lockdown regions respectively.
How does the drop in GHG emissions compare to our Paris climate targets?
In order to meet the objective of the Paris agreement – holding global temperatures to below 2 C above pre-industrial levels – economy-wide GHG emissions must be reduced by 25% (or 55% to maintain a 1.5 C rise) compared to 2018 levels.4
The 5% decline in CO2 emissions from Q1 2020 – and even the likely 25% and 18% decreases for regions in total and partial lockdown – comes nowhere close to this figure.
Why isn’t this enough?
So, even with much of the world’s population staying at home, next to no air travel, decreased purchasing, and the almost complete shuttering of the commercial sector in many countries – this isn’t enough to reach our GHG reduction targets?
How can this be?
To make sense of this, we need to understand a bit about what kind of energy sources we use, and what we use them for.
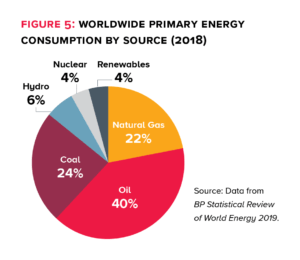
As shown in Figure 5, in 2018 (the most recent year for which global data are available), oil and coal accounted for 64% of worldwide primary energy consumption, with natural gas at 24%, nuclear at 4%, and hydroelectricity and renewables combined at 10%.
Coal is the energy source associated with the highest GHG emissions, at approximately 100 Kg CO2e per British Thermal Unit (Btu). About 68% of coal is used for electricity production (producing about a third of all electricity worldwide) with about 28% used to power industrial processes such as iron and steelmaking, manufacturing and mineral extraction. About 4% of coal burned is for residential heating.5
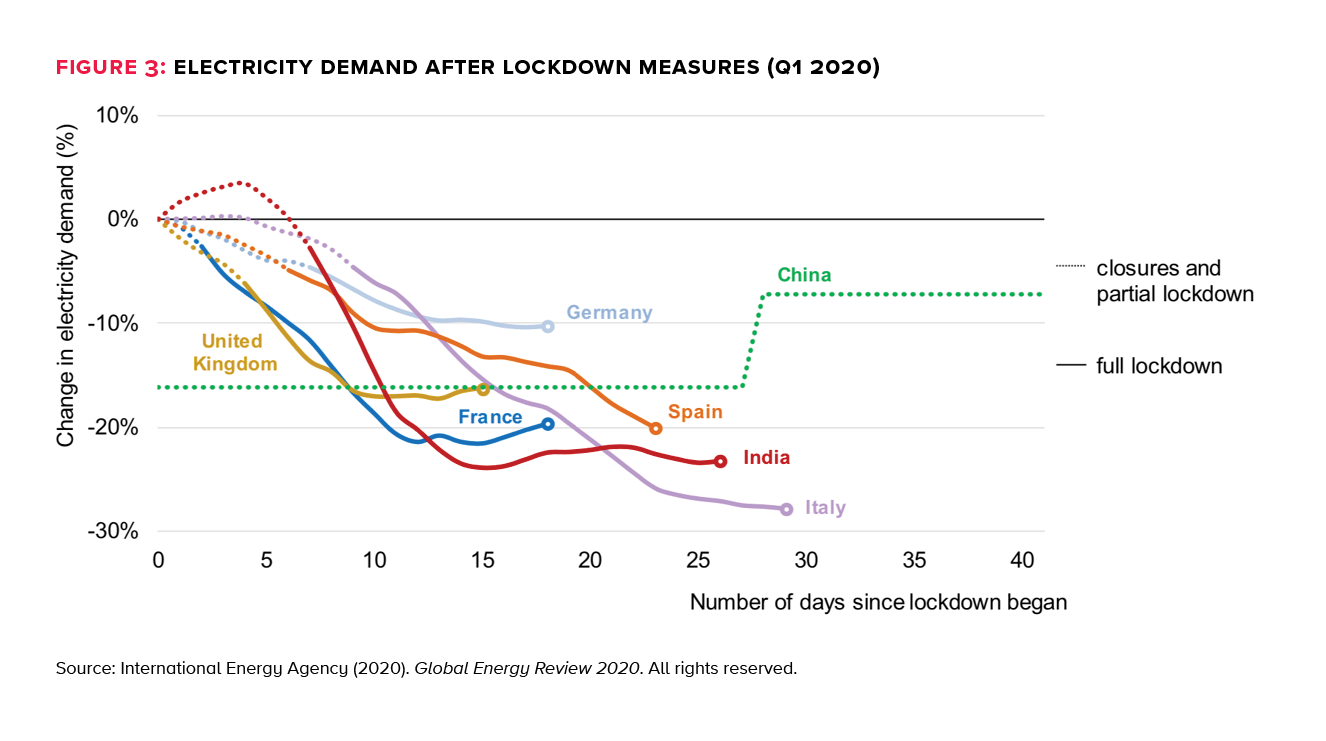
Coal demand fell roughly 8% globally during Q1 of 2020 — the largest decrease of all primary energy types. This was tied to the decrease in electricity demand and shut-in industrial operations, particularly in China and for industries such as auto production and cement manufacturing. However, not all industrial coal use was shuttered; for example, during the same period there was an increase in coal use for steel production in China.6 In addition, although electricity demand dropped (Figure 3), coalbased electricity generation was far from eliminated.
Oil — also relatively high in associated GHG emissions — is primarily used for transportation, which represents over 77% of combusted oil (industrial use is about 9% and ‘other’ use — residential, agriculture, etc. — is about 13%).7 Although personal vehicle use and passenger airline travel dropped dramatically during the lockdown, commercial transportation was largely maintained, at around 80% of normal volumes in Canada.8 This was important in maintaining health and well-being; although people’s lives were upended, for the most part supply chains remained intact, allowing food and other necessities to continue being transported and distributed.
Natural gas, the next-largest slice of the pie, is also an important source of electricity production, with around 41% of natural gas burned for this purpose, and the remainder being used to power industrial processes and for ‘other’ (mostly residential) purposes. As with coal, the IEA reported reduced demand for natural gas resulting from declines in electricity and industrial use, along with mild temperatures across the northern hemisphere. But as with coal, natural gas was required to supply remaining needs.
Finally, nuclear energy, hydroelectricity and renewables (including biofuels) — with relatively low GHG footprints — are used almost entirely for electricity generation or residential heating/ cooking. These renewable sources were relatively unaffected by the COVID-19 lockdown measures. Partly, this is because renewable sources are often dispatched before fossil fuels (due either to low operating costs or because they are given priority),9 and there is little enough renewable supply that the full complement was still needed.
The impact of the lockdowns was visible to individuals, as many people stayed in their homes, many retail businesses closed, and the streets and skies emptied of cars and airplanes. But at the same time, the world ticked on in the background: much manufacturing continued, commercial transportation did not drop in the same way as personal transportation and energy/electricity use shifted location from commercial workspaces to houses. And while this caused an unprecedented drop in energy use and disrupted the delicate balance of supply and demand for energy (viz. plunging oil prices), the majority of world energy demand remained intact.
What are the implications for what we need to do?
Although there is widespread recognition of the need to change energy production and consumption in a way that will effectively reduce GHG emissions, it is hard to imagine that anyone would want to replicate the adverse effects of the lockdown on a long-term basis.
So, what does this mean for the future, and for the actions that need to be taken by individuals, governments and organizations?
The first implication is that there is a very real chance that it will not be possible to meet the Paris targets. The extraordinary global event that has unfolded over the last few months is predicted to result in only an 8% decrease in energy use and emissions for this year. In comparison, the U.S. Energy Information Administration predicts a 50% increase in global energy use by 2050,10 driven by surging population and economic growth. These two figures may be irreconcilable.
The second is that only limited impact is possible via behavioural change. Actions such as driving less, flying less and reducing consumption that were undertaken involuntarily during the COVID-19 lockdown had a meaningful impact on GHG emissions. But these actions resulted in severe and extremely costly economic strain that is not sustainable — and unlikely to be voluntarily complied with — over an extended period.
Third, policies to incrementally reduce GHG emissions from current energy production/ consumption — carbon taxes, carbon intensity standards, etc. — are likely to have an almost negligible impact, since none of them is predicted to “eat into” energy consumption in a way that comes anywhere near the effect of a lockdown. This is not to say that such measures shouldn’t be established, but it needs to be done with: a) an understanding of their likely overall small effect; and b) serious consideration of the cost-benefit ratio of introducing the measures.
What this points to is clear: if Canada and other countries are serious about hitting the target of reducing GHG emissions by 25% (or 55%) by 2030, fuel switching is going to have to occur rapidly.
• Natural gas as a transition fuel will be essential – it was responsible for a 3% decrease in emissions in the United States in 2019 alone, as power plants shifted from coal to natural gas.
• Nuclear power has to be considered as a serious option.
• The true potential of different renewable options has to be weighed – objectively and honestly. Renewable energy has limits. As energy historian Vaclav Smil makes clear,11 all energy types have adverse consequences, renewables included. It is not helpful to stampede from one type of energy production to another if the solution is only marginally better, or perhaps only differently bad, than the problem we are trying to leave behind.
Many citizens were willing to make fairly extreme sacrifices to prevent an even worse pandemic. But a society in which we don’t work, travel, shop or meet friends is not a society we want. What we need are viable alternatives to our current energy system that have at least as great an effect on GHGs as the lockdowns – without the pain. Because what we are seeing today can’t be tomorrow’s energy future. And as we have seen with the figures from Q1 2020, major structural shifts in energy production and consumption will be needed to get us there.
Endnotes:
¹ In International Energy Agency (2020). Global Energy Review 2020.
² IHS Markit. Oil Price Information Service (OPIS) as reported in the Financial Post, April 7, 2020: https://business.financialpost.com/pmn/ business-pmn/demand-for-gasoline-is-plummeting-all-over-the-world
³ The IEA estimate models only CO2 directly, rather than all GHGs; and includes only emissions related to energy use—the largest source — and not agriculture, landfill outgassing, etc. The total CO2 emissions for the peak in 2018 are therefore smaller than total GHG emissions for that year, estimated in the UN Emissions Gap Report to be 55.3 GtCO2e.
4 These figures—taken from the UN Emissions Gap Report of 2019 — are a simplification of a complex situation, and many competing models of emissions exist. However, there is broad agreement that to prevent more than a 2 C change, a reduction of at least 25% will be required.
5 International Energy Agency. World Energy Balance and World Final Consumption Sankey diagrams. 2020. https://www.iea.org/sankey/
6 International Energy Agency (2020). Global Energy Review 2020.
7 International Energy Agency. World Energy Balance and World Final Consumption Sankey diagrams. 2020. https://www.iea.org/sankey/
8 Geotab. The impact of COVID-19 on commercial transportation and trade activity. May 7, 2020. https://www.geotab.com/blog/impact-of-covid-19/
9 International Energy Agency (2020). Global Energy Review 2020.
10 U.S. Energy Information Administration. International Energy Outlook 2019.
11 Smil, V. Energy and Civilization: A History. MIT Press, 2017
Further discussions of this brief with Marla Orenstein, Patrick Smith and Energi Media can be found here and here.